Hive weight: reading the hive scale day by day
Hive weight is the most honest data a colony gives you: how a hive scale tells you when to harvest, whether a swarm has left, and if winter stores will last.
If you could measure one single thing about your hive, and one only, what would you choose? I would have no doubts: the weight. Not because the other data points do not matter, but because hive weight is the most honest of them all. It is not swayed by mood, it needs no complicated interpretation: it is the balance, literally, of what comes in and what goes out. How much nectar the bees are bringing in, how much honey has piled up, how much they burn through during the lean months. Everything ends up, sooner or later, as a single number.
But the real point is not today’s number. A hive weighed once tells you very little: 42 kilos can be excellent news or a warning sign, depending on what it weighed yesterday and what season it is. The value lies in the curve, in the way that weight moves day after day. It is that line, rising, flattening, dropping sharply or sliding down slowly, that tells the story. A hive scale, in the end, is there for exactly this: to turn a series of weighings into a diary you can read without ever lifting the lid.
It is late June, the honey harvest is under way across half of Italy, and it is the perfect moment to stop and understand what that curve is telling us, season by season.
Spring and the nectar flow: the weight that rises
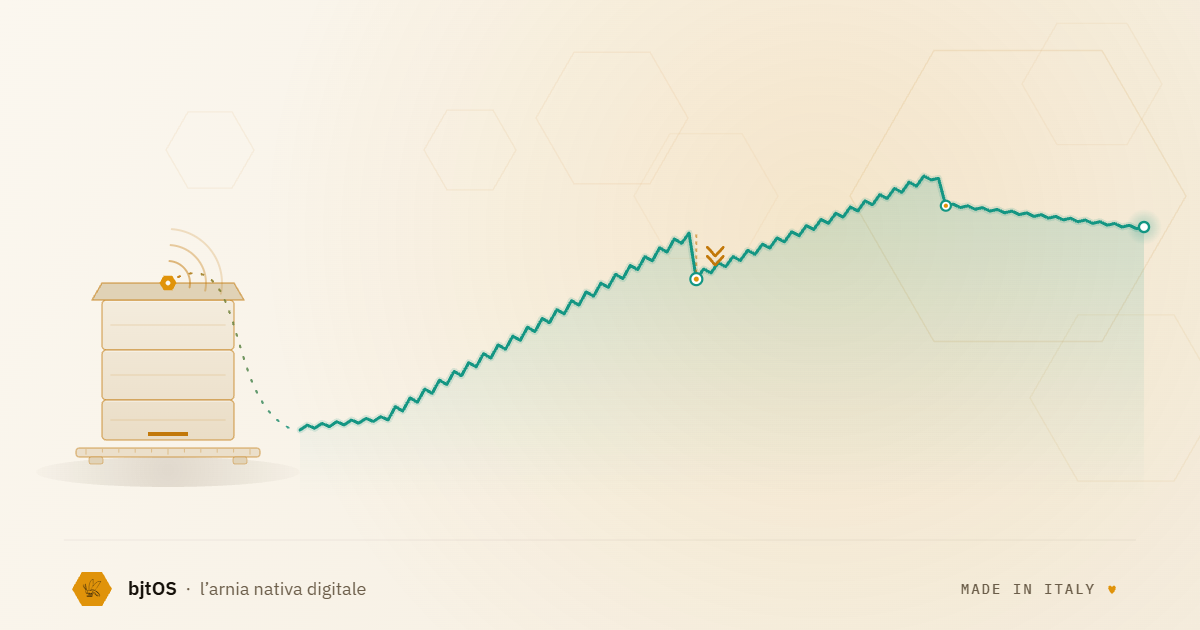
The cheeriest page of the diary is the one for late spring and early summer, when the nectar flow runs at full tilt. On a good foraging day, a hive can gain one, two, even three kilos from dawn to dusk. The curve rises in steps: by day it climbs as the foragers return laden, by night it dips slightly because the bees fan and evaporate the water out of the nectar to turn it into honey.
That sawtooth shape, rising by day and easing down by night, is the signature of a harvest in full swing. And it tells you practical things: if the rise suddenly slows while the weather is still good, the bloom you were counting on may be ending, and it could be worth thinking about moving the hives. If instead it stays vigorous, you know the colony has room and that you might need to add more before it feels cramped. Tracking the weight here does not replace the inspection: it makes it targeted, because you arrive already knowing what to expect.
When to harvest, read from the weight
The question every beekeeper asks at the end of the flow is just one: when to harvest? Opening up too early means collecting honey that is still unripe, too wet, at risk of fermenting. Waiting too long means leaving supers full when the colony might already need them for itself, or being caught out by a bloom that ends abruptly.
The weight helps you read this moment better than any calendar. As long as the curve keeps rising, the nectar flow is still on: the bees are gathering, and you are accumulating. When the climb stops and the line flattens for several days in a row, with good weather, that is the sign the flow has dried up: the harvest is over. From that point the bees stop adding and start working on the stores already in place, ripening and capping them. It is often there, in the days after the plateau, that the harvest makes the most sense: the honey is made, capped, and you are no longer removing nectar that would have become a harvest. The scale does not decide for you, your eye on the capped frames stays decisive, but it tells you precisely when to stop waiting.
The sudden sharp drop: swarming (or theft)
There is one movement, in the weight curve, that makes anyone watching it jump: the sharp drop. Not the slow decline of a bad-weather day, but a fall of one, two, even three kilos in a few minutes, in the middle of the season. That shape almost always has a name: swarming.
When a colony swarms, half the bees and the queen leave together in a matter of moments, and the weight records exactly that mass walking out the door. Swarming with a weight drop has an unmistakable signature, a vertical step downward at a precise time of day, usually during the hottest hours. Knowing it the moment it happens, and not three days later when you find the queen cells, changes everything: you can rush to recover the swarm while it is still nearby, or step in on the sister colonies before they follow suit.
The same step, though, off-season or at night, tells a different and unpleasant story: theft. A hive that suddenly loses ten or fifteen kilos in the dead of night is not swarming, it is being carried off. This too the weight curve captures in the exact instant, and a connected scale can turn it into an alert that reaches you right away, not a bitter discovery at the next visit.
Autumn and winter: the stores that dwindle
Once summer is over, the curve changes character and becomes, if anything, even more important. From September on, the weight stops rising and the long, slow decline of the cold months begins: these are the winter stores being consumed, week after week, to keep the colony alive and warm. This phase has no dramatic twists, but the stakes are extremely high, because the whole winter’s risk has just one name: starvation.
Here the weight becomes a gauge of autonomy. Knowing what the hive weighs in autumn and at what rate it is falling, you can estimate with good approximation how many weeks of stores are left, and tell whether the colony will reach spring on its own strength or whether it will need help by late winter. A minimum weight threshold, set by you, becomes a safety net: when the hive drops below that value, you know it is time to step in, without having to open hives sealed shut by the cold just to check. It is the difference between catching starvation in time and noticing it too late.
The curve counts, not the snapshot
You will have noticed the thread tying all these readings together: none of them is made on a single weighing. The sawtooth rise, the plateau that signals the harvest, the step of a swarm, the winter slide toward the starvation threshold, are all shapes that exist only over time. This morning’s weight, on its own, says almost nothing. It is the curve, the sequence of weights day after day, that is the true diary of the hive.
And this is where a connected scale changes the game. Weighing by hand is possible, of course, but you do it when you are at the apiary, maybe once a week, missing exactly the details that matter: the spike of a swarm happens in minutes, the plateau of the flow can only be read by comparing several days in a row. A scale that weighs continuously and sends you the data remotely records every movement, even when you are elsewhere, and gives it back to you as a clean line on the screen. This, in practice, is precision beekeeping: no longer instruments in the beekeeper’s hands, but data that reaches you wherever you are, letting you decide with real insight. If you are curious about the journey the weight makes from the hive all the way to your phone, I told it in the page dedicated to the technology behind the data. And if you want to see how it fits into a bigger picture, I have also written about how a smart hive works as a whole.
A scale designed inside the hive, not glued on top
There is a reason I became so passionate about the weight specifically, and it is the same one driving bjtOS forward. A scale that tells all of this should not be an accessory bolted under the hive at the last moment, with the risk of unbalancing it, suffering from the damp, or drifting out of calibration after a single season. It should be part of the hive from the design stage: the weight measured by the floor itself, with the care you put into a working tool, without distorting the object the beekeeper knows and trusts. It is the idea of a digital-native hive, and the scale is its heart: if you want to see the shape it is taking, I have gathered it in the page dedicated to what we are building.
And for you, how many times would the weight curve have got you there a day earlier, or saved you a wasted trip?